My new summer physics lab: Google’s nexuscontraption
The Google elves have been busy putting together a Rube Goldberg game that really is just a big add for their latest phone, but I prefer to think of it as my summer physics lab.

Experiment 1: How do objects fall in the Google lab?
This is a pretty basic experiment. Let’s just drop the ball, and record its motion using Tracker Video Analysis.
Note: if you closely examine this video, you’ll see places where the ball doesn’t seem to move between frames. I think this frame doubling is somehow an artifact of either the Flash animation or SnapzPro, but I’d appreciate any advice this matter.
Despite this, I decided to go ahead with the investigation, and produced this graph of the y-velocity of the ball vs time. One of the beautiful things about doing video analysis on video games is that the contrast is so high, Tracker can autotrack objects with tremendous ease.

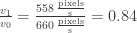
So the ball seems to be falling with a constant acceleration of 


The diameter of the ball is about 31 pixels, or about 0.51 m. Those are fairly large balls they’re dropping in the lab. No wonder they need robot claws.
Experiment 2: Exploring the properties of Google’s rubber bands
One of your primary tools for moving objects around in the game is to use rubber bands. Let’s see what we can find out about these rubber bands.
Here’s another video of the ball making 2 bounces on the rubber band.
And here’s the graph of the y-position of the ball as a function of time.
![]()
Here’s a graph of the speed of the ball versus time.

If we know the speed of the ball before and after the collision, we can calculate the coefficient of restitution (COR) which is defined as ratio fo the speed after the collision to the speed just preceeding the collision.
We can read these values in 
First collision
This coefficient seems pretty high, since a golf ball hitting a hard surface has a COR of 0.86, but maybe Google has some very special rubber bands.
Experiment 3: Exploring the dynamics of forces exerted by rotating oscillators.
On the next level, you get access to fans, which turn out to be an idea tool for exploring forces. Let’s see how the balls move when under the influence of a fan.
And here’s a graph of the x-position of the ball:
![]()
There are two interesting features of this graph—near the beginning of the motion the graph is curved, which indicates that the velocity is increasing. Later, the graph becomes straight, indicating constant velocity, and that the airstream of the fan is no longer exerting a force on the ball.
So how big is the acceleration of the ball? For that, we need to turn to the velocity graph.
![]()
We see the velocity of the ball is initially increasing at a constant rate of 

Future experiments
For now, I’ll stop here. But I do have more questions that I’m curious about:
- Can I find the spring constant of the rubber bands?
- Can I find the mass of the ball? Or at least compare its mass to the mass of a block?
- Can we find the coefficient of friction of the lab tables in the Google lab?
In the hopes that someone else might take up some of these questions, I’ve posted the remaining three videos I have left to analyze here, here and here.


I thought that the coefficient of restitution was the ratio of the speed before and after the bounce, not the ratio of the bounce heights. My son did the math for his 5th grade science fair project and got the ratio of the bounce heights to be r^2.
Click to access Science_Fair_2007_report.pdf
If he made a mistake then, I’d like to know about it!
I just looked up Coefficient of Restituition on Wikipedia, and their presentation agrees with what my son did. I know that Wikipedia is not a primary source, but I’m now confident that the definition of COR you used in your analysis is incorrect.
Thanks—I recalculated the results for the correct definition of COR. If the only force during the fall is a gravitational one, it should also be that COR is , but for some reason, that’s not quite working out, since for the case of a projectile in free fall,
  I’ll come back to this later and try play with it some more.
I hate when I get the frame doubling. It makes me scream. One thing I found to minimize this was to not use screen recording software. Instead I point a video camera at the screen. This seems to help even if it is way more work.
Oh – and if you get double frames, it pretty much destroys your velocity graph unless you use some other method to create it. Not sure how tracker does it.
Rhett,
Thanks for the suggestion about filming directly. That’s what I’ve done for some ipad things I’m working on, and I guess I’ll have to try this out.
John does the frame doubling happen for the same frames if you run the exact same experiment twice? If not you could run and record a few times and patch the data together.
If you can figure out the frame rate of the Google stuff, you could change your recording method to mach the frame rate. Frame doubling results from having a higher recording rate than the animation rate.
Of course, for this to work the animation would have to be at a constant frame rate, you’d have to be able to determine that rate, and you’d have to be able to control your recording software to match that rate.
Oh I see. I was just thinking it was dropping frames. Mismatched source and recording frame rates makes much more sense.
I’m not seeing how to find the frame rate of a flash animation you don’t have the source code to. My searching revealed lots of code libraries I could add to flash animations I created to measure the frame rate, but no alternatives for animations you just find on the net. Might it be possible to simply record the animation at a higher speed (using a high speed camera at 120 Hz, for instance) and then measure the frame rate directly? Also, my understanding is that the FR in flash is highly dependent on the processor load, so I might need to do to something to standardize this when testing…