The app I need right now
So I and every other teacher right now are scrambling to get ready to teach school online. Here’s a problem I’m grappling with that I would welcome your advice.
In my Geometry class, we do a lot of group problem solving on wall mounted whiteboards using problems from the Exeter curriculum. It is so helpful for me as a teacher to be able to walk around the room, see students work, ask them questions, give them feedback, and then return later to see how their work has progressed.
I’ve been wondering a lot about what this might look like online. We’re using zoom, and of course there are break rooms, and even a rudimentary “whiteboard” built in where students could finger paint their work. But the reality is, most kids will be doing math work with pencil and paper, and it seems like it will be very hard for me to see that work as it progresses.
My students have all gotten very used to submitting scans of their written math homework using scanbot each night, and this is a great tool for seeing what students have done, but it isn’t seamless enough to really be useful for students to share their math work as they are going.
Here’s what I want—I want an app that allows a student to take a photo of their work. When that student’s work is photographed, it’s added to our class, tagged by student, date and time. Then all of these photographs would be nicely presented to me some way so that I could quickly see a students work, or step through their submissions. It would be extra awesome if I could some how annotate or give feedback to a student’s photo.
This seems like it would be pretty efficient for a student who was working on math and had their phone next to them. They’d just open the app, take a photo, and the work would be there for all to see.
I know students could just hold their notebooks up to a webcam, or take a photo fo their work, air drop it to their laptop, and then screen share. There are also lots of ways to do this saving to Google drive and other such cloud storage tools. But all of these seem to clunky to really foster conversation about math while students are doing it.
Are there any tools out there I’m not aware of that could do this? Is there some other approach that might work?
Challenging Coronavirus with Connections and Puppets
My school, just like every other school in the world, has told students not to come back from break, and asked faculty to begin to make plans for virtual school. If you check twitter, you’ll see it’s filled with plans and ideas for teaching virtually, and there are a ton of great resources there. More importantly, there’s a real community of people out there who are lend advice, listen, help out and so much more.
One idea that has stuck with me in the past two weeks is this one from Evan Weinberg, who’s been teaching online for the past five weeks:
At the moment, so much is uncertain about how our school is going to do virtual school—are we going to try to keep to our schedule? How can we teach students in 10+ time zones synchronously? I’ve decided to stop trying to think about possible lesson plans and just focus on thinking about how I will try to maintain those connections with my students. In that regard, this is one of the best things I’ve read on twitter (click through to see the amazing letter this professor sent to her students):
As my two daughters (now 9 and 5) have had their first day of no school, I was reminded just how important this was when we sent an email to a friend we made in Norway last year this morning. When we left last summer, we said we’d keep in touch–our daughters were best friends. But life got busy, and this was our first time reaching out. A few hours later, my 9-year-old, Maddie, and Barrett, her best friend, were taking on FaceTime. While I was working on lunch, I was tuning in and out of their conversation—at first they were awkwardly asking each other questions, then being interrupted by little siblings, and then spending an amazing amount of time playing around with emojis, but soon Maddie was giving Barrett a tour of her house, and then they sat down and played Legos together. Barrett aimed the iPad at her lego set, and asked Maddie which lego character she wanted to be. Then what did she want the character to do, and on and on. They played legos for more than 20 minutes, and it was an amazing thing to see. These are the moments we are going to need in the weeks ahead, more than any lessons on math or social studies.
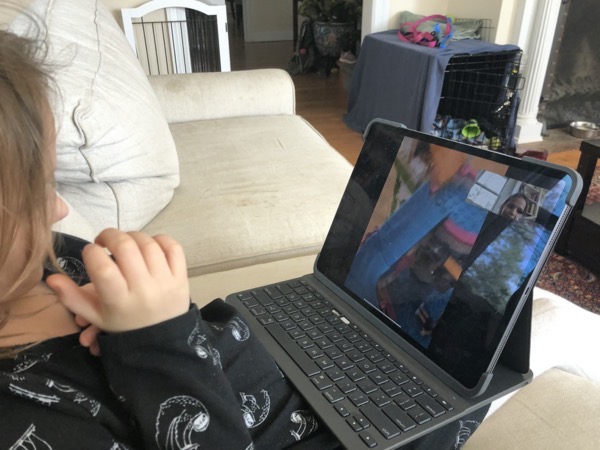
I live on a boarding school campus, and it is teeming with kids of all ages, none of whom can play with each other thanks to social distancing. A few years ago, my wife started Eco-Kids Club, an environmental club for faculty children that meets most Sundays and does fun projects to help or learn about the environment—learning about recycling in our state, hiking in the woods, painting kindness rocks and more. Obviously, Eco-Kids club is on hiatus for the coronavirus, but it got me wondering what if we could find a way to build some connection online.
So after some thinking, I sent out this email to faculty parents at my school:
Calling all Ecokids! We need some eco-superheros for the first-ever eco kids superhero virtual puppet show! You can be a hero, save the world, and do it all from the comfort of your home.
Diana and I are planning a virtual puppet show for all eco kids—in a few days, we want to invite all of the eco kids (and their parents) to perform a virtual puppet show via zoom that we are going to design, record, and share with the community.
Here’s what we need from every eco-kid:
Make a puppet of your eco superhero: Recycle some of the stuff around your house and that you find in nature to create a puppet of your eco-superhero. Be creative—it doesn’t need to be fancy. If you’ve got some extra time and want to make some props to go with your superhero, go for it!
Take a picture of your puppet, give it a name, and tell us the story of your superhero in a couple of sentences. What are your superhero’s superpowers? Where do they come from?
Get your adult to send me an email with the photo, name and a sentence or two about your eco-superhero.
For example, Ada wants to create an eco-bunny whose superpower is hopping around the forest and picking up trash.
I will compile all these photos and descriptions and share them back with all of us.
Once we’ve got our cast, we’ll spend half an hour writing a very simple script where our eco-superheros save the world. We’ll have this writers meeting on zoom, and we welcome everyone, even if you didn’t get to make a puppet.
Who can participate: Anyone! Even if you’ve never been to an eco-kids club meeting. If you’re an older kid, we could really use your help in working with our team to come up with a script. Adults—you can make a puppet, too!
On Friday, we’ll get together again on zoom and we will film our puppet show, and share it with the community, hopefully teaching everyone that when the world needs a hero, sometimes, you can just make one up.
Parents, we don’t want this to create work for you—we are hoping this will be a nice small project for your child to work on one afternoon, and a couple of opportunities to talk to other kids on campus virtually as we work together on a fun project. If you’ve got ideas for how to make this better/easier/more fun, we’d love to hear them.
If you think you or your kids would like to participate in this project, please email me so that I can add you to the mailing list for future communication.
Tentative schedule (we’ll poll all participants to find times that will work best)
Wednesday 4pm—submit a photo of your puppet, name and 2 sentence description.
Thursday 10am-11am—scriptwriting meeting
Friday 10am-11am—rehearsal and filming of the final puppet show
I’ve gotten three replies, which gives us half a dozen or so puppets for our production. I’ve never done anything theater-related before, and I was super relieved when the daughter of our wonderful Theater director decided to join this project. Hopefully, you’ll see what we put together next week.
Once we get past all the schedules, assessments, and other details about what virtual school will look like, I hope we’ll be able to find some time to think about how we will create real moments of connection for our students using the incredible tools that are available to us—the very tools that we too often malign agents of distraction and disconnection.
Pivot Interactives and Tychos—even better together
I’m a huge fan of physics teacher written software. At the moment, I think three of the most useful pieces of software for physics teaching are written by physics teachers:
- SBGbook: This is the best standards based grade book I know of, created by Josh Gates.
- Pivot interactive: One of the most easy to use tools for video analysis, featuring an awesome library of Direct Measurement Videos, where students use a virtual meter stick and stop watch to make measurements of objects in the video. Pivot was created by Peter Bohacek, and he and his team of incredible students have done some amazing work building a huge library of chemistry and biology videos that make it possible to assign laboratory work as homework
- Tychos: Tychos is an amazing platform for creating computational models in the browser. It was created by Winston Wolff and Steve Temple, another physics teacher.
If you know of other physics teachers who have created pieces of software, I’d love to hear about them. I think Jeff Hellman, author of Planbook was also a physics teacher before he became a full time developer.
In this post, I’d like to describe how we are using two of these tools, Pivot and Tychos to help our students explore motion, and better understand the notion of a model.
Our Intro Physics students (mostly 10th graders) have just finished their study of the Constant Velocity Particle Model, and we wanted them to get a chance to do some sort of practicum to test out their understanding. Rather than have them do the classic buggy collision lab, we decided to let try our Pivot and work on this Rolling Ball Challenge. Students were already familiar with Pivot from an activity we did earlier in the unit, and after some hiccups, they all found it very easy to use and even fun. Students can directly measure the position of each of the balls, and enter their measurements directly into a simple spreadsheet on the webpage. From there, they can plot their data and perform a linear regression, again, right on the webpage. And finally, the cool part is after making measurements of a segment of the video before the balls collide, they can test out the prediction they get from their mathematical model on the full video.
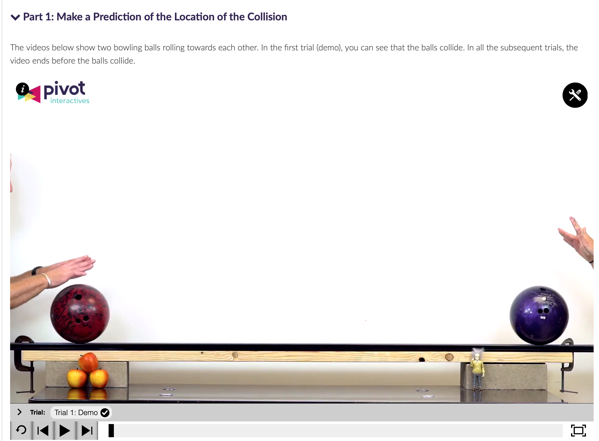
This worked out great for most of our students. In 30 minutes of homework time they were able to successfully model the collision and test their preciction.
On the next day, we wanted to introduce computational modeling with Tychos, so we gave students this partially completed simulation, and a carefully scaffolded set of instructions.
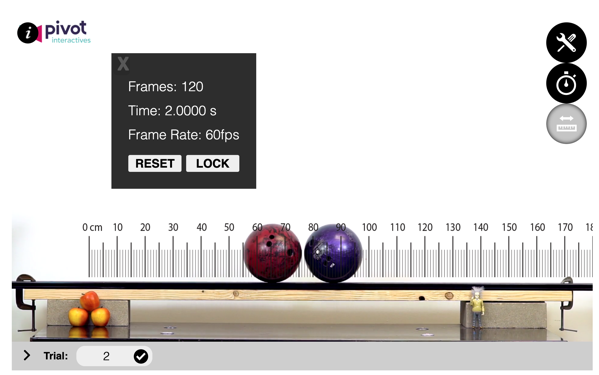
Here’s what students see when they open the simulation and run it for the first time.
The instructions walk them through the steps needed to make the Tychos simulation match what they see in the video. They have to change the initial position of the purple ball, change the initial velocity of the red ball, and then add a line to the calculation tab to update the position of the purple ball. All in all, by editing two lines of code and writing another two, they can build a working computational model. They can even use the example in the code to add the position of the purple ball to the position graph, and change the sizes of the balls to match the bowling balls from the experiment. After all that, they can then step through to find when the balls collide.
If students come in with working mathematical models, it takes only 20 minutes or so for them to follow the instructions to figure out how to change the position and velocity of the objects in the computational model. Once they test their model, they notice something very interesting. The collision in Tychos takes place well before the actual collision in the simulation—why is that?
This is when we look back at the Pivot experiment, and how we measure data. I project this image, that shows the ruler the students used to measure the position of the two balls.
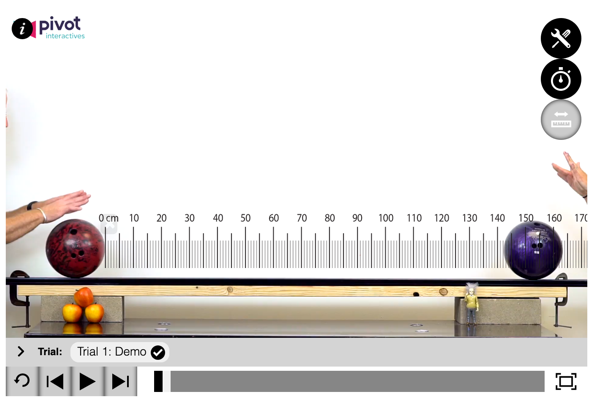
Very quickly, someone realizes that in Pivot, we were measuring in the position of the ball to be the location of its leading edge (right side for the red ball). We did this because it makes for easy measuring. But for Tycos, it automatically assumes that the position of the ball is the center of the object. I ask the students to think with their partners about how they might modify this simulation to account for this difference, and soon, some group realizes that if you push the starting positions of each ball out by one radius in Tychos, the motion in the computer model will match the motion in the video.
Once we did that, we got great agreement between our simulation and the video, which was wonderful. More importantly, I think students got a much better appreciation for what a model is, and in particular, what we mean by the notion of “particle model” and how we can modify our model to account for the behavior of extended objects like bowling balls. It’s even better that we could see this in the very first situation we tried to model.

Certianly, this exposure to Tychos was heavily scaffolded—the point was to get students to see that they could use a tool like a computer to build a model of a situation to make predictions, not to understand the ins and outs of the Tychos javascript syntax, which we will surely get to in future lessons. This didn’t stop students from appreciating that they’d written their first program, and my students were almost universally excited to work with both of these tools again.
Climate week warm up—let’s analyze some data
This week is climate week, and on Friday, I wanted to have a short assignment that would get my students thinking about climate change before we headed out for our observance of the worldwide climate strike.
I decided I would create short warm up activity where I would give students a data set of some quantity. I anonymized each data set so that all students knew is that they were analyzing a time series of data for some quantity and asked them to spend 5 minutes analyzing and making a graph, and then we would share our work with the class. After each presentation, I then revealed what the dataset was.
Here’s the data I used
- Data set 1: CO2 concentration from 1958.
- Data set 2: Arctic Sea ice extent in September for the past 40 years
- Data Set 3: Global temperature anomalies for the past 140 years (January Measurements)
- Data Set 4: global Temperature Anomalies for the past 140 years (September measurements)
- Data Set 5:Area of the Agassiz Glacier in Glacier National Park for the past 120 years
I shared an empty Google slides presentation with the class, and asked each group to produce one slide with their graph and any observations they made in 5 minutes of analysis.
Here’s the reveal slide deck I created which explains what each of the datasets are.
This turned out to be a great 10 minute activity. Students were able to figure out easily how to make scatter plots in Google sheets, and came up with all sorts of other insights. Everyone was taken aback when they realized the origin of each dataset and its implications.
Teachers Coding: exploring CalDav files
It’s the start of the school year, and for me on of the big mundane tasks is getting my calendar set up for the school year. Our school’s home-brew SAS has this great feature that will generate .ics file containing all of your classes that you can import into Google calendar or any other calendaring program. But it has one problem—all of your class data is in the single file. Since we have a new rotating schedule, I was hoping I might be able to put each class into it’s own calendar in order to let me better see how a particular class is mapping out through the upcoming weeks.
When I thought about it for a bit, I realized this was a great opportunity to put my coding skills to use. I knew an .ics file was basically a text file that listed all of the events to be imported into the calendar. I opened up the calendar file in a text editor (Atom, in this case) and took a look:

If you look closely at this file you see the structure is pretty simple. The first 7 lines are the header that sets up the calendar, and then every event begins with a BEGIN: VEVENT and ends with a END:VEVENT 7 lines later.
That got me thinking that I could write a python program that would find the first event, and then parse it in 7-line chunks, writing each chunk into a file based on which class it was associated with (the SUMMARY line).
I knew the python is great for this thing, but I’d forgotten the finer points of reading and writing files, so I Googled it. I also didn’t know about how I would parse the text file in 7 line chunks, but googling “parse text file n lines at a time python” sent me to this very helpful post that introduced me to itertools and the islice function which does exactly what I needed.
Here’s the program I came up with (link to code on Github Gist):
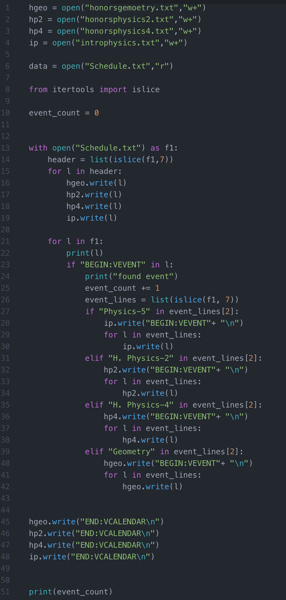
If you’re interested, here’s a 5-minute screencast where I explain how this code works
All told, it took me about 45 minutes to write this code, which is probably close to the amount of time it would have taken me to just cut and paste the original file into 4 separate calendar files. I’m also sure there’s some regex expert out there who could have done this in 5 seconds, and if you’re reading this, I’d love to hear about it in the comments.
If you were at my school, or happened to have a similar calDav file containing events with the same name that you wanted to separate into individual files, you should be able to modify the search strings in line 27, 31, 35 and 39 to whatever you’re looking for, change the names of the output files in the first 4 lines and you’d be good to go.
Now, I’ve got a much better idea of how CalDav files work, and can think of a lot of ways to modify this program:
- If I knew all the days I was going to give a quiz in a class, I could put together a file that would list all of the quiz days to share with my students.
- I could modify this program to calculate the total number of class periods or total minutes I have in a class.
- I could export my Google calendar as an .ics file, and then use a program like this to analyze all sorts of questions like if I had logged my workouts, how often do I workout in the past year.
Measuring the length of a pendulum with a microbit
Here’s a write up of another activity I’ve been working on as part of my sabbatical.
In college, I remember a dean telling us the joke about the student who was challenged by their professor to measure the height of a building using a barometer, and all the ingenious ways in which the student came up with complete the task: tying a piece of string to the barometer and lowering it from the side of the building to measure the heigh, dropping the barometer off the top of the building and measuring the time it takes to hit the ground, offering the barometer as a gift to the building superintendent in exchange for the height of the building, and more.
Inspired in part by this joke, I decided to see if we might be able to use a BBC micro:bit to measure the length of a piece of string. First, I want to give a serious shout out to the micro:bit as a pretty amazing tool for exploring computing. They are small (2in x 1in) integrated circuit computers that include an array of sensors (light, temperature, accelerometer, compass), a 5×5 LED display, 2 physical buttons, 25 pin outs, and bluetooth wireless connectivity. They’re also cheap ($15) and very easy to program in a block based javascript, or text based python. The platform has a ton of accessories and curricular materials, and seems to be in pretty wide use across the UK and Norway, and probably many other places as well. Microbit is the easiest microcontroller platform I’ve ever worked with, and I think they would be an ideal platform for any middle of high school STEM class looking to add some embedded systems programming to their work.
When I first started playing with micro:bit, it took me about 10 minutes to follow these instructions about Live data logging with Python and Mu (a great beginning python editor for programming micro:bit), and suddenly I had an accelerometer that could wirelessly transmit its readings to a second micro:bit serving as a receiver connected to my computer. This got me thinking, could I use the micro:bit as a pendulum?
Here’s a description of what I did, with some ideas for how to turn this into an actual activity for students in physics class.
Measuring the length of a piece of string with a microbit
The microbit is just about the perfect size to serve as pendulum bob, and it’s easy to attach a battery pack and string through one of the pre-drilled connection holes.
The first thing I needed to do was modify the program from the live data logging example to calculate the magnitude of the acceleration, rather than logging the 3 components for the x, y, and z axes. Thanks to the great documentation of the platform, and the built in tooltips of the mu editor, I was pretty easily able to come up with this program for the accelerometer:
from microbit import *

import radio

import math

radio.on()
while True:

sleep(20)

a_x = accelerometer.get_x()

a_y = accelerometer.get_y()

a_z = accelerometer.get_z()

a_mag = math.sqrt(a_x2+a_y2+a_z**2)

radio.send("("+str(a_mag)+",)")
and the receiver program was unchanged:
from microbit import *
import radio
radio.on()
while True:
message = radio.receive()
sleep(20)
print(message)
The beauty of the mu-editor is that it will automatically graph any data that is displayed using the print function with its built in plotter. (To take advantage of this feature, the data you print must be sent as a tuple, a single data value followed by a comma, and the radio.send function requires the transmission of a string, so this is the reason for the slightly strange notation of the radio.send argument in the transmitter).
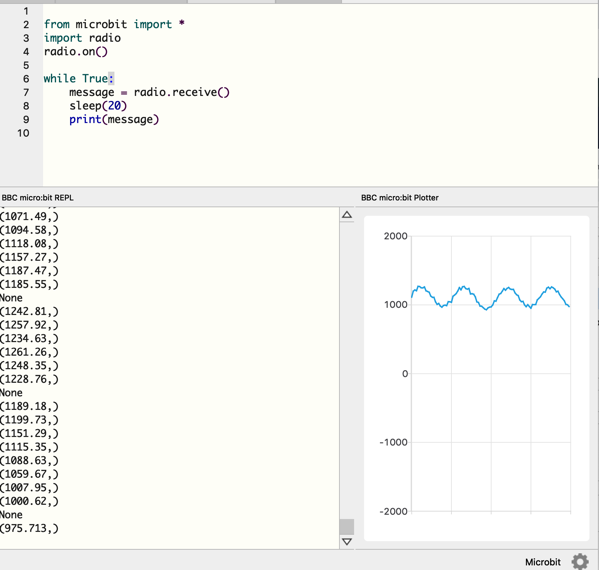
Unfortunately, the mu-plotter is very limited in terms of what it can do—you can’t rescale the axis or do anything to manipulate the data. But mu-python also automatically saves each data run as a .csv file inside the “data_capture” folder within “mu_code”, which you can import into a spreadsheet. Once you’ve imported the data into the spreadheet, you can add a column of time measurements (this program takes readings every 20 milliseconds), and then graph and fit that data.
Since Geogebra is heavily used in Norwegian high school, I decided to try my hand at it for fitting sinusoid data. After pasting the data into the spreadsheet, you need to create a list of points, using the toolbar as follows:

You can then use the FitSin function to fit the list of points:

Knowing that the angular acceleration of the pendulum can be written in general as
The angular frequency for this pendulum must be 11.32 rad/s.
For a simple pendulum,
which we can rearrange and solve for L:
Hmm—something here isn’t right. It’s calculating a pendulum that is 0.07 m long.
Update: I realized the problem seems to be in the code—the sleep(20) statements in the both the pendululum and the receiver seem to combine to making the actual time between data points 0.04 seconds, rather than 0.02 seconds. Taking this into account would make the angular frequency of the pendulum 5.66 rad/s, giving a much more reasonable value for the lenght of the pendulum as 0.30m.
Note 2 (May 28): I think I’ve fixed the bug, but if you encounter an error loading the site, I’d greatly appreciate you reaching out via twitter, this blog, or email.
Note: it seems like the site has a bug I missed and isn’t loading in production. I’m traveling now, but will try to take a look at it tonight and fix it.
When I announced Physics Coach a couple of months ago, I thought I was just a few edits from being done. Of course, I’d totally forgotten the lessons I’d learned from reading The Mythical Man Month back in college. But with two more months of tweaking, I’m ready to share a beta version of Physics Coach complete with a few new features. Also, I again have to send big thanks to my former students, Holly, Yousaf, and Leo who were amazing pair programming companions for much of the development, and tremendous earth shattering thanks to Jason, a totally random reader of my blog who offered to help with the project, implemented a bunch of features and guided me through countless challenges.

New Features:
- Support for multiple courses: it’s now possible for teachers and students to be enrolled in multiple courses. Practices completed for a course also only appear in that course.

- Streamlined interface: Rather than ask three different questions at the end of each practice, Physics Coach just asks students to rate how well they accomplished their goal, notes on their practice, and write a question they thought of during their work.
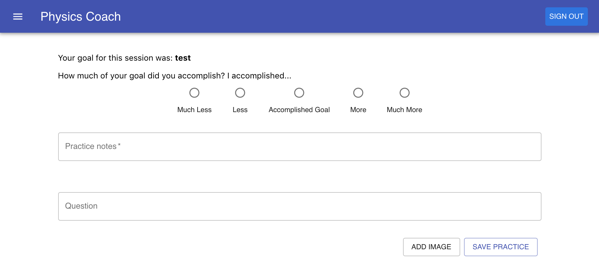
- More data: Practice cards now show show more information, including the practice time, and emojis to indicate how well you accomplished your goal (🔥🔥 = accomplished much more than your goal). The question mark icon in the corner also indicates whether you have an open question associated with this practice (red= open question, green = closed question).
- Open and Closed Questions: after each practice, practice coach asks you to write a question that you still have. By default, this question is considered unanswered or open, until you go into the practice card and mark it is answered, which will change the color of the outline of the textbook, and the question icon on the practice card.

- Push Protocol: Back when I assigned homework consisting of a number of problems for students to solve, it often happened that students would come in the next day talking about how they struggled on a particular problem and spent an hour or more without making any progress. This sort of frustrated practice is a major detriment to student learning—it causes great frustration, decreases student self confidence, and can quickly lead to the student hating physics. To prevent this, I took some inspiration from Cal Newport, and asked students to recognize when they hadn’t made progress on a problem for 5 minutes, and in these moments, to write everything they’d tried to solve the problem, a question that would help them to get unstuck, share this with their teacher and then to move on completely from physics and start working on something else.I’ve created something similar in Physics Coach—once 5 minutes passes, the “I’m stuck” button becomes active, and if a student finds that they can’t make any progress on a problem for 5 minutes, they should press this button and will be asked to document their work, and write a question that would help them to make progress again.


Possible future directions:
- Creating summary page: this might show your recent practices, or a graph of your feeling of accomplishment over your most recent practices.
- Push protocol alerts: I’d like to create setting where the teacher would get sent an email when a student submits a push protocol practice, so that the teacher could respond with help.
- Comments: I’d like to add in the ability for teachers and students to add comments to their practices and questions.
- A question tracker page: I’m thinking it might be helpful to pull all of the questions from practices into their own page so that students might be able to browse and review those questions.
- Practice sharing: It might be useful for students to be able share their practices, especially push protocol practices, with other students in their class so that they can get feedback from their peers.
At this point, I really need some feedback from users to decide where to go with this app, so I think I’m ready to turn it over for beta testing. You can begin using the app right away. Here’s how:
- Go to https://physics-coach.firebaseapp.com/ and login with your Google account (at the moment, only users with Google accounts can use Physics Coach).
- To experience the student side of the app, enroll in the test course by following this link, and clicking the request to join button.
- To get set up as a teacher, please complete this short beta test request form, and I’ll convert your account to a teacher, which will then let you create your own course, and enroll students by sending them the link to your course.
That’s it. I’m a bit bummed I wasn’t able to get this app out earlier in the spring so that we might be able to get some real student testing. But I appreciate any testing and feedback you might be willing to share over the summer.
While on sabbatical, I’ve had much more time to devote to working out. Back in it was warmer, I developed a decent slow running habit which I tracked in Strava, and once it got colder, moved to gym workouts which are tracked by an app built by my gym.

One of the things I’ve noticed is how helpful these apps have been for motivating me to workout—seeing a graph of how many times I’ve worked out this week is usually a good nudge to push me out the door when I’m not feeling fully in the mood to going to the gym, and Strava gives me a wealth of tools for analyzing my runs, even showing me all the super fit Norwegians in my neighbohood and how much faster they run around the local park than I do.
All of this got me thinking, what would an app to track physics workouts look like?
Last year, I implemented Casey Rutherford’s excellent homework policy that abandons traditional “assigned” homework (“do problems 1-33 odd for tonight”), and replaces it with asking students spend a certain amount of time practicing physics in a way that will increase their understanding and then document that practice. In my first year physics classes, this worked out to asking students to practice physics for 3 hours outside of class each week, and giving them a weekly menu of options focusing building skills, problem solving and extensions. Here’s an sample of a what a weekly practice menu looks like.

I asked students to document their work in practice log that consisted of Google doc that shared with me, starting each week’s practice with a table that documented the time, duration, and what they did for each practice, and then to include photos of their written work as evidence of what they did. To make it easy to look at each students’ practice log, I built a simple dashboard, in Google sites and put a link to each student’s log on this page. When I wanted to give students weekly feedback, it was easy to open all of the logs for one class on individual tabs and then quickly add comments and questions using the Google Docs commenting tool.
Overall, this turned out to be an awesome way to do homework. It was very easy for me to engage students in deep discussions of physics by adding comments to their work. Students were able to find meaningful work that they could custom tailor to their needs. Students also quickly saw how well practice correlates with improved understanding on assessments. For the most part, students were also very responsible about doing practice, even though it wasn’t graded at all (I only wrote feedback. Interestingly, I also think students felt more guilty about not doing physics practice than they would have felt for a more traditional homework assignments.
Most of the downsides came down to the requirement to document. Getting photos into Google docs and typing up what you did in a table became tedious for many students, and they struggled to see any benefit, especially when they didn’t engage my feedback and just chose to work on a new thing every night, and for some students this became a major roadblock to their progress.
Introducing Physics Coach
All of this got me thinking that there should be a way to make this easier. After seeing how easy it is to log a run or workout in Strave or at the gym, I stated to think “There outta be an app for that…” and I set out to build physics coach.
I spent quite a bit of time this year learning React, Redux and Firebase, and by far the greatest motivator for learning this has been setting a goal of writing this app, rather than just trying to “learn React.” Also, so much of the progress I’ve made with this app and as a software developer has been due to regular pair programming sessions I’ve had with three former students, Holley, Yousaf, and Leo and one amazing student at the University of Illinois, Jason, who reached out on my blog. I’ve now got a decent working prototype that I would like to explain here and invite your feedback.
This web app supports Google authentication, and after students login and are assigned to a class, they will see a screen that looks like this.

When the student opens a new worksheet session, they see a screen that looks like this, prompting them to enter a goal for this practice session. (Right now the timer defaults to 1 minute for testing purposes, but can be set to anything).
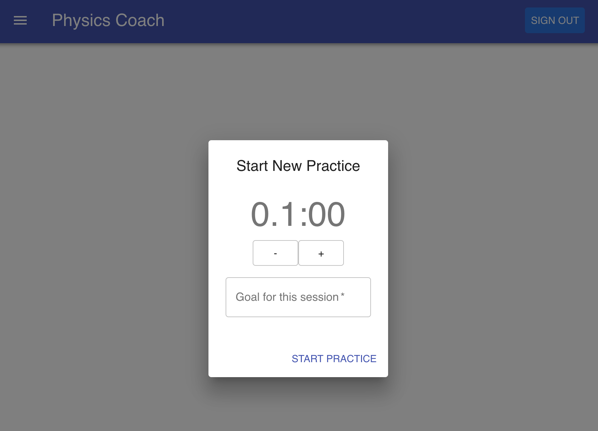
Once you press start session, a simple Pomodoro-style timer comes up like this:

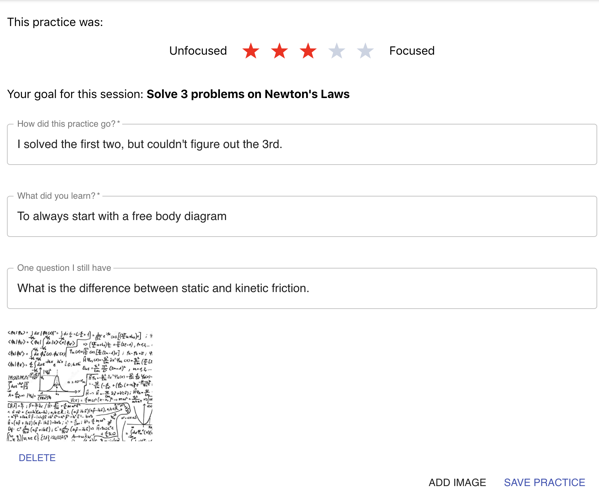
When the session concludes, the student is brought to a screen asking them to do a bit of reflecting on their session:

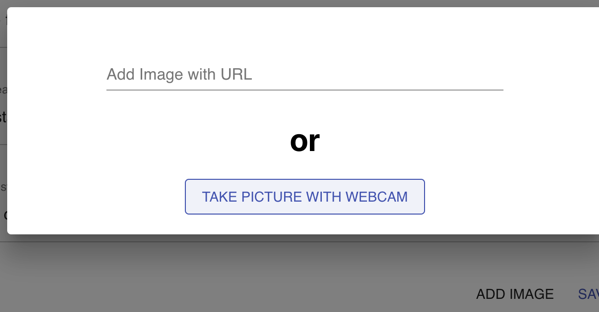
And they are then given the option to upload photos of their work, including by capturing photos from the webcam.
Once you save your practice, you can go back and view previous practices:

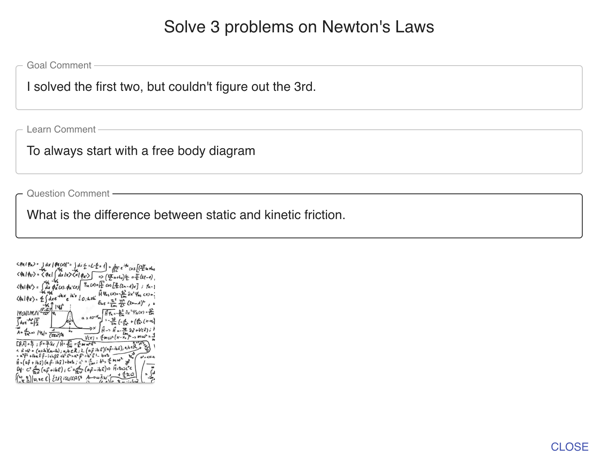
And examine one practice in detail:
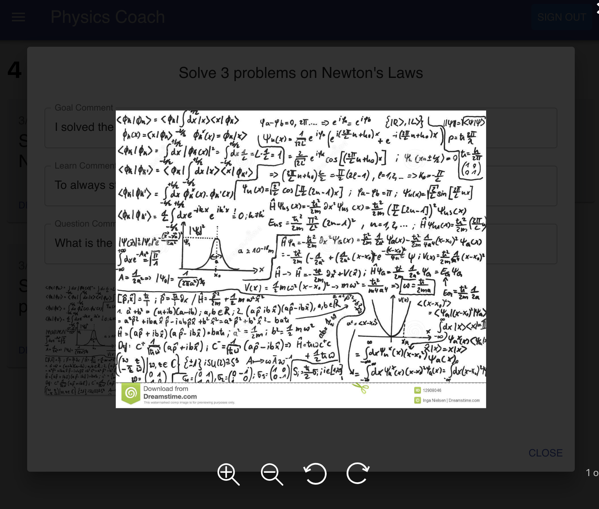
And if you click on an image, you bring up a lightbox element that lets you zoom in on the photo.
All of this is working seemingly nicely at the moment, and I’m working on adding a few other features:
- Courses & Roles: putting students into courses, and setting up a “teacher” role so that a teacher can see all of the students in their class.
- Commenting: We want teachers to be able to add comments to a students practice session so that the teacher can give helpful feedback to the student.
- Push protocol: I’d like to add a button for students to press when they’re stuck. If they’ve worked on something for 5 minutes, and haven’t made any progress at all, I want them to press this “push protocol” button, and it would ask them to document their work with a photo, explain why they are stuck, and then create a record of this practice. I’m thinking about possibly creating a way to share those “push protocol” practices with the class, so that other students in the class could offer feedback and suggestions.
- Image annotations: I’m thinking it might be nice to be able to specifically annotate images of student work.
- Tagging: I’d like to add tagging support, so you might be able to tag things like about your practice process “listening to music”, or “studying in library” or content/action tags, like “kinematics” or “reviewing for test”.
- Simple analytics: Similar to my gym all I’d like to show a student how many times they’ve practiced recently, and perhaps give them a tool to see how their and level of focus varied over time and with various factors like time of day.
I want your feedback and would love some beta testers
I do have lots of questions:
- Does this seem like something that might be useful for your classes?
- Do you think students would be willing to use this app to log their practice sessions?
- Am I asking the right metacognitive questions at the end of each practice?
- What other features might you want to see in an app like this?
If you’re interested in seeing physics coach in action, you can try out a slightly older version than the one pictured above at https://physics-coach.firebaseapp.com/ (you’ll need to authenticate with your Google account). You can also check out the code at my github repo.
I would really love to find a couple of teachers interested in beta testing this with their students. If you might be interested, please leave a comment here, and we can talk about how to set this up for your class.
Computing in Mathematics: Build your Own Calculator
For the past few Fridays, I have been teaching my first ever lessonsto a class of Norwegian students, and I wanted to write about the experience here.
This class was a class of 30 or so Norwegian students in Mathematics 1T, which covers the the topics of precalculus and differential calculus. The students in this course had just finished studying functions, and function notation.
I asked students about their previous programming experience—many students had done some programming in scratch, one had done some work in HTML, and none had any experience in Python.
Here is initial throught thought about how to structure a series of lessons for incorporating programming into math class. Students are already quite comfortable with calculators like Desmos and Geogebra, and readily see their utility in mathematics. Why not introduce Python as a sort of “build your own calculator,” emphasizing their ability to program their own functions that will be useful for future work?
Ideally, I could imagine that students in an Algebra 2 or Precalc class build a file of functions that would be useful for their own work in mathematics—functions to find the x-intercept of a line, the roots of a quadratic, or even the slope of a fuction at a point. Once students learn to master a procedure, they then develop that procedure into a function in Python, and later, are free to use that function on future assignments.
For this type of introduction, I decided to start students off in the Repl.it web programming environment. If you have internet connectivity in your classroom, Repl.it is a great environment to work with because there’s nothing to install or configure, and yet you get the exact same Python interface you would get from installing IDLE or Anaconda (without having to wait half an hour for Anaconda to download).
The other choice I made was to start by working directly with the Python interpreter, rather than writing actual Python scripts. This requires students to enter commands where into the interpreter one at a time. After most commands, the interpreter gives you some feedback. So if you enter “3+7”, you’ll see 10 appear below the prompt. If you try to enter a command that requires multiple lines, like a function definition, the interpreter prompt switches to an ellipses “…” allowing you to enter each line of of the command. And if your line happens to include mismatching parentheses, you’ll be able to tell because Python won’t return to a normal prompt until the braces are matched. Finally, if you have any syntax errors in the line you wrote, you’ll get immediate feedback in the form of an error message right under the line.
I think there are a number of advantages to first working with the Python interpreter. In normal Python programming, where you are running a script, your errors appear in a separate window, and I’ve found it very hard for students to connect and interpret these error messages as having important feedback about their code. If you want to check the value of a variable, you simply need to type the variable name on its own line, and Python will print the contents of that variable. Working in the interpreter also gives you an opportunity to predict the output of each line of code before running it, which is also a valuable activity when first learning to program. And finally, for the exercise of building your own calculator, working in the interpreter feels much more like how a calculator actually operates.
Lesson Plan
Every student brings up the a Python environment using repl.it on their laptop.
We start by entering some simple addition problems into the interpreter—”4+6″, and I ask them if they can figure out and check the other mathematical operations—subtraction, multiplication and division, and they quickly find “-“,”*” and ,”/”.
I then show them the “%” operator, and ask them to spend some time exploring what it does. I start by giving them some examples.
5%3 --> 2
6%3 –> 0
10%3 --> 1
I ask the students to spend some time exploring this operation. What are the possible outputs for this operation? What exactly is this operator doing?
Students make some interesting discoveries—the output is at most 1 less than the second number in the operator. When we get more systematic, exploring 1%3, 2%3, 3%3, etc, they see the output follow a cyclic patten. Eventually, students are able to predict the pattern from a few examples, and then with a bit more nudging, and some cross cultural discussion about the differences in division notation between Norway and the US (did you know that the US division sign functions as the minus sign in Norwegian? And long division on Norway looks completely different from how I was taught), they recognize the modulus operator that gives you the integer remainer from division.
At this point, I give them a cheat sheet of various python commands I pasted together from the internet and ask them to spend a few minutes exploring some of the examples in the cheat sheat. When we report back, students have discovered all sorts of neat things like
print(“Hello” * 2)
>”HelloHello”
Defining functions
Since students had just studied function notion, and my ultimate aim was to help them build a library of useful functions for mathematics, I decided to introduce them to defining functions in Python.
Students see that function definitions in Python can look remarkably like mathematical function definitions. We start with a simple linear function.
def f(x):
    return 2x+3
Python also makes it pretty easy to create piecewise functions, like this
def f(x):
    if x >= 0:
        return 2x+3
    else:
        return 3
Next, we talked about the difference between a variable and a parameter, and how in the code below, the x in the function is not the same as the variable x—this tends to be a very confusing concept for students who are just starting out with programming.
x = 3

def f(x):

    if x >= 0:

        return 2x+3

    else:

        return 3
This was pretty much the end of the first day of programming and 90 or so minutes of work. A week later, I came back with a Desmos activity I had created to help them test their ability to read code and understand basic Python operations. The first screen was a matching exercise where students matched 4 small 2 line programs with their output.
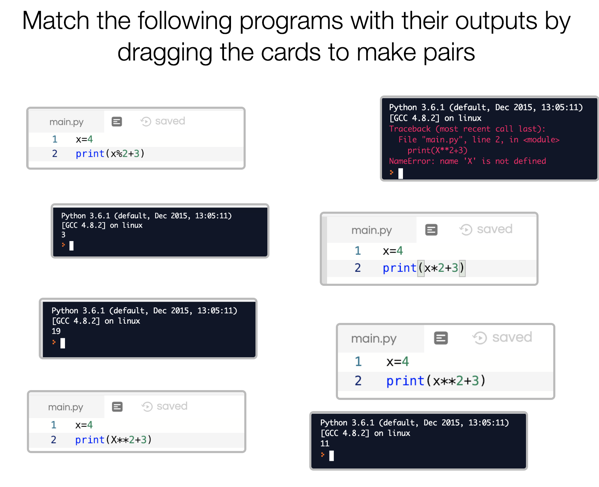
Then students took a crack at reading and predicting the output of a small program: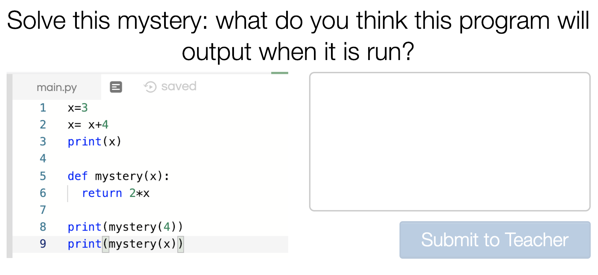
Thanks to the awesome computation layer, I was able to create a follow up screen that showed students what they wrote as the output and ask them to resolve any differences between their prediction and the output of the program.

Lastly, I created a simple slider for students to state how they felt about our work thus far:
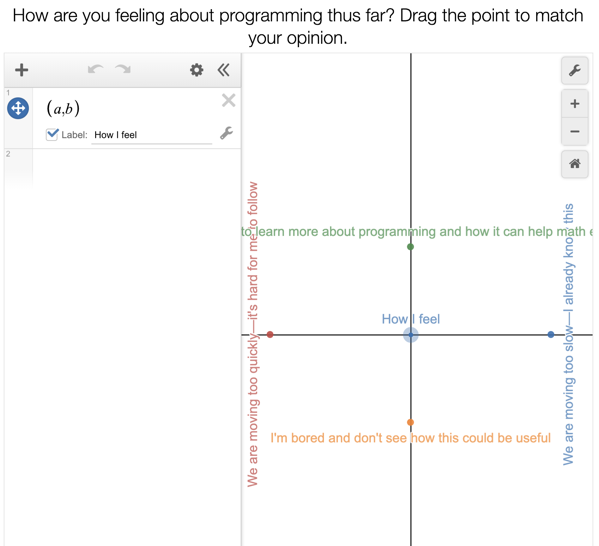
Once we discussed their work on this Desmos activity, I wanted students to see how we can use Python to define functions that aren’t “mathematical” and so worked together to develop a function that would take an (x,y) pair as an input, and return the Quadrant that contains that point, I, II, III or IV.
We began this process by developing a small flow chart to help us think through the logic:
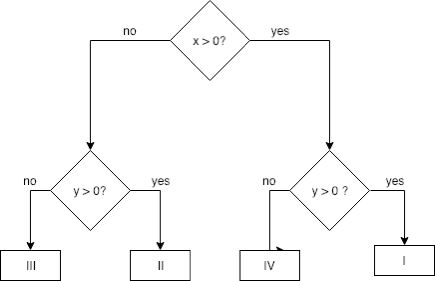
From this, I tried to do some interactive live coding where students would tell me what to write, and eventually, we put together a function that looked something like this.
  if x < 0:

    if y > 0:

      return "I"

    else:

      return "IV"

  else:

    if y > 0:

      return "II"

    else:

      return "III"
It was super helpful to have the flow diagram to go back to be able to show at various points in the coding how much of the function we had written. But as students were trying to follow along to write this program themselves, things went a bit off the rails. It was a bit of a jump to go writing code that had nested commands three levels deep, and I again found myself running around helping students make sense of all the various syntax errors they were being. Not good.
Sadly, class was just ending, so I had to leave with a lot of students feeling frustrated.
On the third day, I came back with another exercise to follow up on our work on the quadrant function. This time, I’d rewritten the code we discussed last time, adding a syntax error and a error in the algorithm, and asked students to spend the first bit of class debugging. This turned out be great. Students did a great job of finding the syntax error, and they were having productive discussions to try to figure out the bug in the program that was producing incorrect output. Many of them saw that debugging is way harder (and more interesting) than just finding syntax errors, and a few that finished early started to walk around the room to help out their peers.
Once we had a working Quadrant function, we started to create our own functions, lke this,
def f(x):
    return x**2 + 4
print(Quadrant(2,f(2))
to see how our function nicely predicts points along an whole variety of functions. We really started to have fun when the teacher suggested looking at the sine function, which I imported, and we could quickly see how our function’s predictions perfectly matched the graph of sin(x) in Desmos.
Reflection
By the end of the third session, some students were really beginning to enjoy programming and thinking through the execution of a program. A few were still finding it pretty frustrating and wondering why programming must be so hard. This is something I really want to work on in the future in my own teaching. Much more than my experience teaching physics, students who begin to program seem to quickly separate themselves into people who develop a quick love for it and people who think it’s not for them. Often, I think this is tied deeply to a student’s previous experience with programming and programming adjacent activities, like taking things apart, working with simple machines, etc, and I would love for a way to help students who think programming is not for them because they aren’t getting it as quickly as their peers to see that often, their peers have had much more previous experience that forms much of the basis of their seeming “intuition.”
I also think there’s a real need to develop many small formative assessments for students who are programming, and to center most of these activities and assessments around reading code and making small modifications to scaffolded code. Too often, I think we ask students to write code from scratch, and not only is this something that rarely happens in the real world of programming, it is deeply challenging for students to work on translating their ideas for a program into an algorithm and then master all the tiny syntactic details necessary to get a working program. There are lots of strategies to help with this, like writing pseudocode, running your program often to find errors, but I think for some students, this still isn’t enough, and a few minutes trying to find your error in the 20 lines of code you just wrote in one sitting is a nearly impossible task.
Finally, I wonder if these assignments are dreadfully boring. It turns out that the Norwegian math curriculum barely addresses the notion of Quadrants, and I’m not sure that students are excited to build a library of functions they could use as their own custom built calculator as I would be. Certainly there are contexts, like working with vectors, calculating cross products and unit normal vectors where this idea might really help students to see just how powerful a Python driven calculator could be, but if we really want students to see the power of programming as a tool to explore mathematical thinking, I think we need to keep working to find better topics to explore.
Coding as conversations: Pair programming
Recently, I saw Aatish Bhatia share this excellent TEDxCalgary talk from Marie-Claire Shananhan and Pratim Sengupta about coding in public spaces.
My favorite quote from the video was, “Learning to code isn’t about acquiring a thing or a skill. It’s about participating in rich and meaningful conversations together.”
I’ve seen this quote in action in many ways this year, in conversation with colleagues at UiO and across the world, on twitter, via Skype and more. But I think the most powerful way in which I’ve seen coding as a conversation has been with two former advisees, H and Y, both of whom are now juniors in college studying computer science.
H and Y were extraordinary advisees, and somehow we ended up keeping in touch once they went to college, scheduling Skype/Google hangouts a few times every semester. Both of them have given me great insights into what college-level STEM courses are looking like these days and many ideas for how we can improve our teaching and student life at my school. We’ve talked about finding summer internships, ethics in computer science, cool class projects they’re working on and much more.<
Recently, I’ve been working to learn React and Firebase to build an app I’ve wanted to create—Physics Coach (blog post forthcoming). For a good part of the fall, I spent a lot of time reading books on React, watching videos, and honestly, not making a ton of progress. It doesn’t help that it seems like the React/Javascript/web development ecosystem is evolving at such a fast rate that notation seems to be changing on a monthly basis.
Earlier this fall, I had the the bright idea to reach out to H and Y for some advice and invite them take a look at some of the code I’d written. Thanks to Zoom and Visual Studio Code Live Share (ZOMG—VS Code is the most amazing code editor ever), it was super easy to set up a pair programming session.
After six or so pair programming sessions with H and Y, I’ve made tremendous progress in developing Physics Coach, and in my understanding of React and Javascript. I think I’ve also given them some good practice for coding interviews as they’ve answered some of my questions and helped to troubleshoot code. We always start our sessions with me setting out a small goal, like setting Firebase up to write the homework sessions into its database or incorporating Google’s awesome material-ui into a login dialog. In all of these sessions, I feel like I’m 10x more productive when pair programming then when I am working on my own—this comes from being forced to explain my thinking and voice the things I’m uncertain of, and having someone else who able to ask questions, share different perspectives and help me talk through the logic of a particular coding challenge.
I think H and Y would say these sessions have been equally valuable for their learning, but I’ll let them speak for themselves in the comments. I also am thinking about how I might be able to bring something like this to my computer science classes. Might it be useful to pull students into a pair programming session with the teacher from time to time? I could see many ways to make this work—from live coding sessions where the student is the driver and the teacher and student are working together to implement a program that is just beyond the student’s current understanding, to having the student as the co-pilot on a more challenging project where the teacher serves as the driver, giving the student an opportunity to see how larger software projects are developed. I also think pair programming sessions with the teacher might help students to understand the value of pair programming better—something I’ve found that beginning students tend to discount when they think the programming challenges are easy and they can solve them themselves.
In the meantime, I think pair programming can be a way to grow the computer science teachers community, especially the <a TeachersCoding movement that Evan Weinberg has written about that seeks to help teachers understand how code can be a powerful tool to help their teaching. So if you’re ever interested in doing a bit of programming, usually after 10 pm Central European Time, hit me up!